This single number captures a stock’s historical tendency to amplify or mute the market’s movements, giving you a crystal ball into its future volatility.
If you are a stock-curious type of person, it’s possible that you have watched your carefully chosen stock plummet twice as hard as everything else during a market sell-off and thought “why is this happening to me specifically?” —congratulations, you’ve just had a firsthand encounter with high beta. Let’s talk about what that actually means.

Think of it this way…
Before we get into the mechanics of financial beta, let’s try to grasp the core idea behind it. Imagine you’re at a party and your friends describe someone as being “intense” or “dramatic”. What does that mean? Maybe they laugh louder than anyone else or, maybe they get angry very quickly, or may be have sharp mood swings? Perhaps, they’re simply reacting to every little thing happening around them. In the world of finance, stocks have personalities too, and the metric used to describe just how “intense” a stock is—specifically, how dramatically it reacts to the market’s mood swings—is called the beta (β).
For beginners stepping into the world of investments, beta is one of those concepts that sounds intimidating, but is actually quite intuitive and easy to grasp conceptually. It is a measure of systematic risk, also known as market risk. It is the kind of risk you simply cannot avoid if you want to take advantage of investing in the markets. In technical terms, beta (β) measures the volatility, or sensitivity—of a stock’s (or any security’s) returns relative to the returns of a benchmark, usually a broad market index like the Sensex or the SsP 100. Think of the market as the relentless tide rolling in and out along the shore. A high-beta stock is like a buoyant cork carried forth by the waves. When the tide surges in, the cork floats three times as far up the beach; when it pulls back, the cork gets dragged farther out to sea just as quickly. Whereas a low-beta stock is more like a heavy clamshell on the ocean floor, stirred by the currents but sliding just inches against the tide’s push and pull.
Another way to think about beta is through suspension systems in cars. Some vehicles are tuned to absorb bumps gently, barely reacting to the road’s imperfections. Others, like that on a race car, transmit every jolt and vibration directly to the cabin. In much the same way, different stocks transmit the market’s shocks and surges with different intensity. A stock’s beta behaves much the same.
So, What Even Is Beta?
Beta (β) is a single number that answers a deceptively simple question: how does this stock move relative to the market? The market itself, say approximated by the Sensex, has a beta of exactly 1.0 by definition. Everything else is measured against that. In statistical terms, beta is simply the slope of the regression line when stock returns are plotted against market returns.
The standard form of the formula is:

where,
𝑅𝑖 is the return on the individual stock, and 𝑅M is the return on the market index
This second version is more intuitive than it looks. Beta is essentially two things bundled together: how correlated the stock is with the market (ρ), and how volatile it is relative to the market (σᵢ/σₘ). A stock can have a high beta because it moves in lockstep with the market but wildly so, or because it’s highly correlated and volatile. Usually, it is a bit of both.
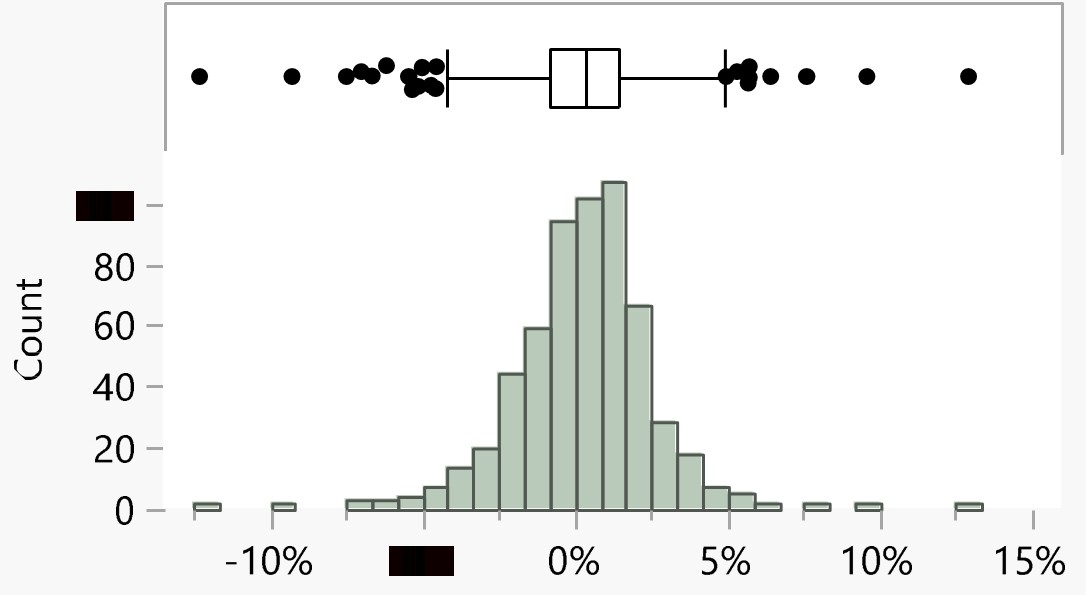
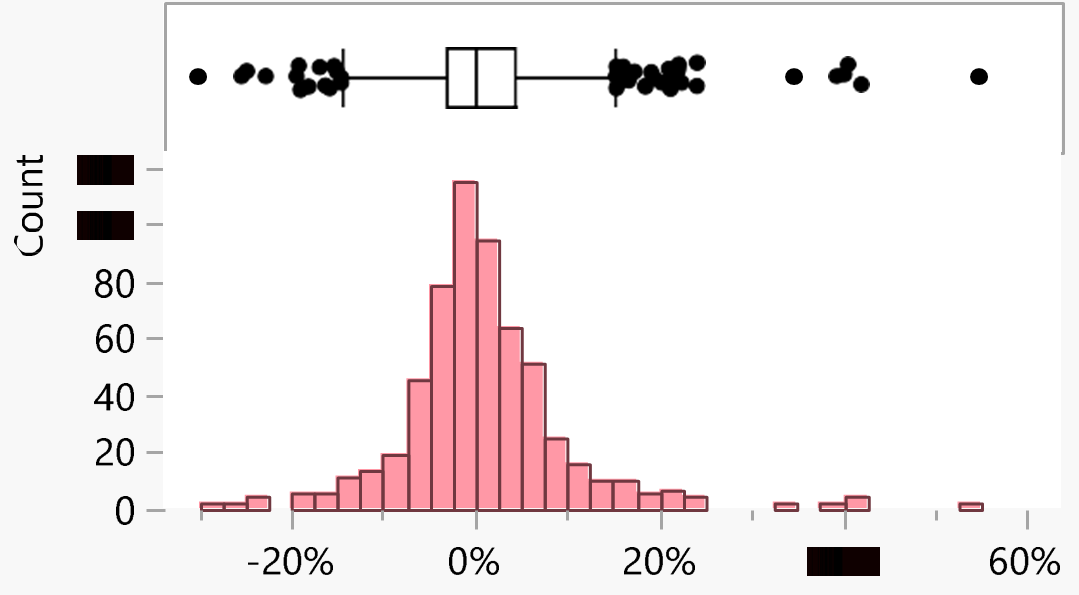
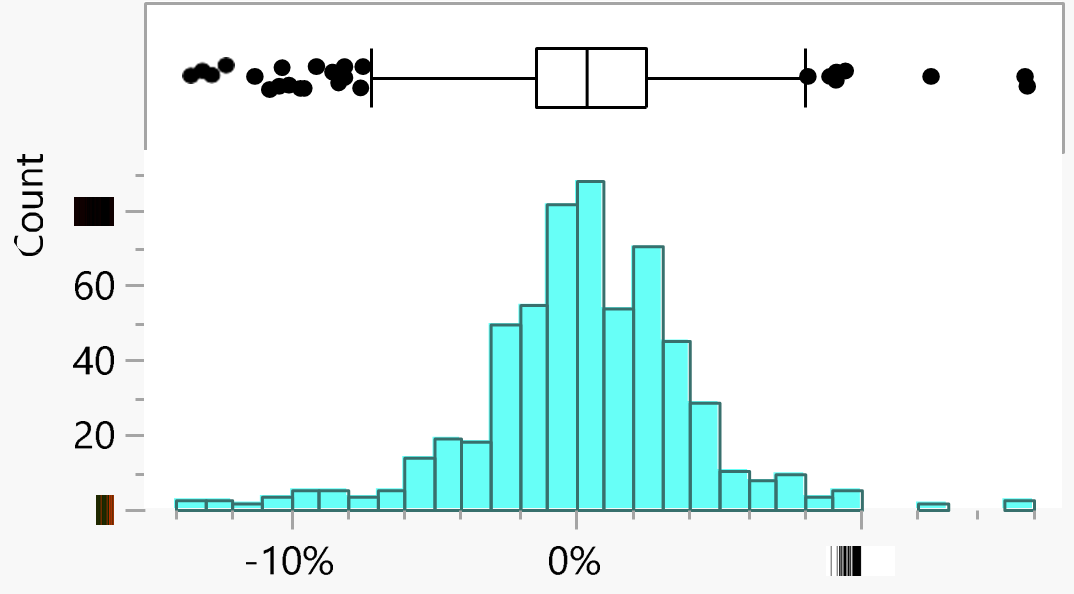
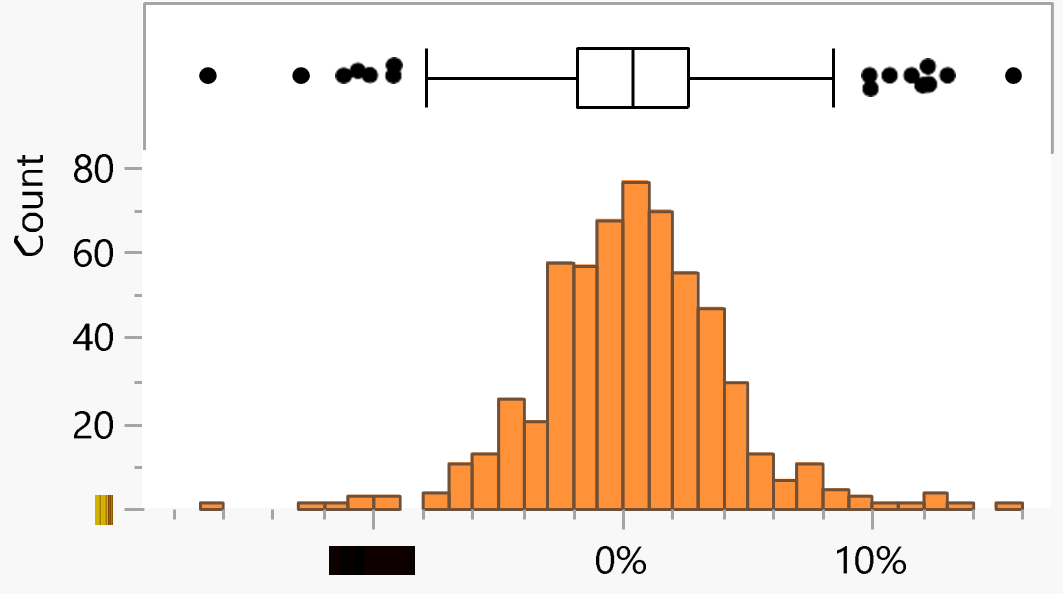
Figures 1(a) through 1(d) show the weekly distributions of various assets between Apr 2014 to Mar 2025.
The Three Characters You’ll Meet
1) The Aggressive Stock (β>1)
In finance theory, a beta above 1 means the stock amplifies market moves. If the market climbs 10%, this stock might climb 15% or 18%. Sounds great. But when the market drops 10%? Same logic applies, but in the other direction. Holding a high-beta stock is a bit like turning up the volume on whatever the market is already doing. Euphoric rallies become more euphoric. Ugly corrections become very ugly. Adani Power’s high beta isn’t random. Power generation companies often have high operating leverage—fixed costs are high, so revenue changes amplify profit swings. During economic expansions, industrial power demand surges; during contractions, it collapses.
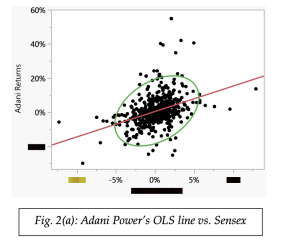
For illustrative purposes, take a look at the Adani Power stock. To find its beta, we can simply run an OLS regression against the market returns.
When we do this, we end up getting a regression line as shown in Figure 2(a), and we get β = 1.488. Notice how the distribution of Adani Power’s returns is visibly wider than that of the Sensex, reflecting greater volatility. Since volatility is one component of beta, this wider spread contributes to its higher beta value.
2) The Defensive Stock (β < 1)
Beta value between 0 and 1 belongs to the what’s perceived as ‘reliable’ stocks. These companies sell their products or services regardless of whether the economy is booming or in a downturn. Their long-term revenues (or service contracts) are sticky or their customers are not deeply tied-in with the performance of the local economy, so their stock prices don’t get dragged as violently by the macro drama. The trade-off is a muted upside. When markets rally hard, a low-beta stock will participate — just less enthusiastically.
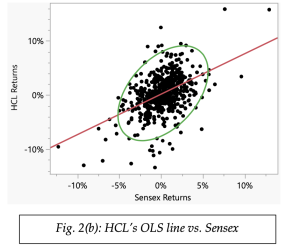
In our small sample of stocks, we can repeat the OLS procedure on HCL’s stock returns to find its beta. This regression is shown in Figure 2(b), and we get β = 0.747.
3) The Market-Mirror Stock (β ≈ 1)
A beta near 1 means the stock is essentially doing what the market is doing, give or take. No drama, no heroics. Diversified industrials, certain large-cap financials, and plain-vanilla broad market ETFs fall here. These are your core holdings — the stocks that keep you in the game without significantly tilting the portfolio’s risk profile in either direction.
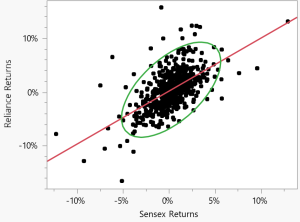
Again, in our small sample of stocks, we can repeat the OLS procedure on the Reliance stock returns to find its beta. This regression is shown in Figure 2(c), and we get β = 0.687, and it is close to 1.0.
But what if β = 0 or β < 0?
This is not a common scenario. When the beta is very close to zero, the stock’s movements are uncorrelated to the market. This is rare for a typical stock. But can be true for other types of financial securities like short-term treasury bills. When beta is negative, the asset moves inversely to the market. When the market goes up, the asset goes down. This is extremely rare for individual stocks but can sometimes be seen with gold or certain inverse ETFs.
The beta value gives us a baseline to form our expectations with regards to the riskiness of a stock vis-à-vis the market. For instance, during a sharp market correction, if the Sensex drops 5% in a week, a stock with a beta of 1.5 might drop roughly 7–8%, while a defensive stock with a beta of 0.6 might fall only 3%. Interpreting beta is straightforward: a beta of 1.5 means that, historically, when the market moved by 1%, the stock tended to move about 1.5% in the same direction.
Beta and the Cost of Equity
Why does beta matter beyond just describing a stock’s personality? It is a crucial input in the Capital Asset Pricing Model (CAPM). The CAPM is used to calculate the cost of equity — essentially, the return that investors require for taking on the risk of owning that stock.
The CAPM formula is given by:
𝐸(𝑅𝑖) = 𝑅𝑓 + 𝛽𝑖 × [𝐸(𝑅𝑀) − 𝑅𝑓]
Where Rf is the prevailing risk-free rate of return and RM is the expected returns of the market.
A Few Points to Keep in Mind
i. Beta is Historical, Not Forward-Looking: Beta is calculated based on past data, which means it reflects how a stock or asset has reacted to market movements The future might not replicate the past, especially if there are changes in the company’s operations, management, or the economic environment. A stock’s beta changes over time.
ii. Beta is Market Dependent: Beta is calculated in relation to a specific benchmark or market index. This means the beta of an asset can change depending on which market index is used, potentially giving conflicting results. Its value also depends heavily on the sampling period and A beta calculated from daily returns over two years can differ meaningfully from one calculated using weekly returns over ten years.
iii. Changes in Capital Structure Changes Beta: A company’s debt-equity ratio can change over time, affecting its risk Beta doesn’t automatically adjust for shifts in capital structure.
iv. The Linearity Assumption: Beta assumes a linear relationship between asset returns and market returns. However, this relationship might not hold in real-world situations, especially during a sell-off or other extreme events.
v. It is important to remember that beta captures only the systematic risk of a stock. A company could have a low beta yet still be extremely risky due to poor governance, excessive leverage, or fragile business models.
Now that you’re comfortable with the idea of beta, keep in mind that it is not the final word on a stock’s risk. No single number ever is. But it is an indispensable starting point. It quantifies the market-related volatility that diversification can’t eliminate, anchors the cost of equity in CAPM, and helps you build portfolios that are aligned with your risk tolerance.
Written By — Prof. Abhijith S